UX/UI Case Study: Mobile Geofencing App Design Concept
Introduction
Overview | The ideal story | The real challenge | The real model — causes | The real model — contexts | Role &process | Design methodologies
Overview
I started the SmartPet project during UserFocus’s training on usability, with a goal to get practical with the UX process and research (doing proper interviews and putting paper prototypes in front of users).
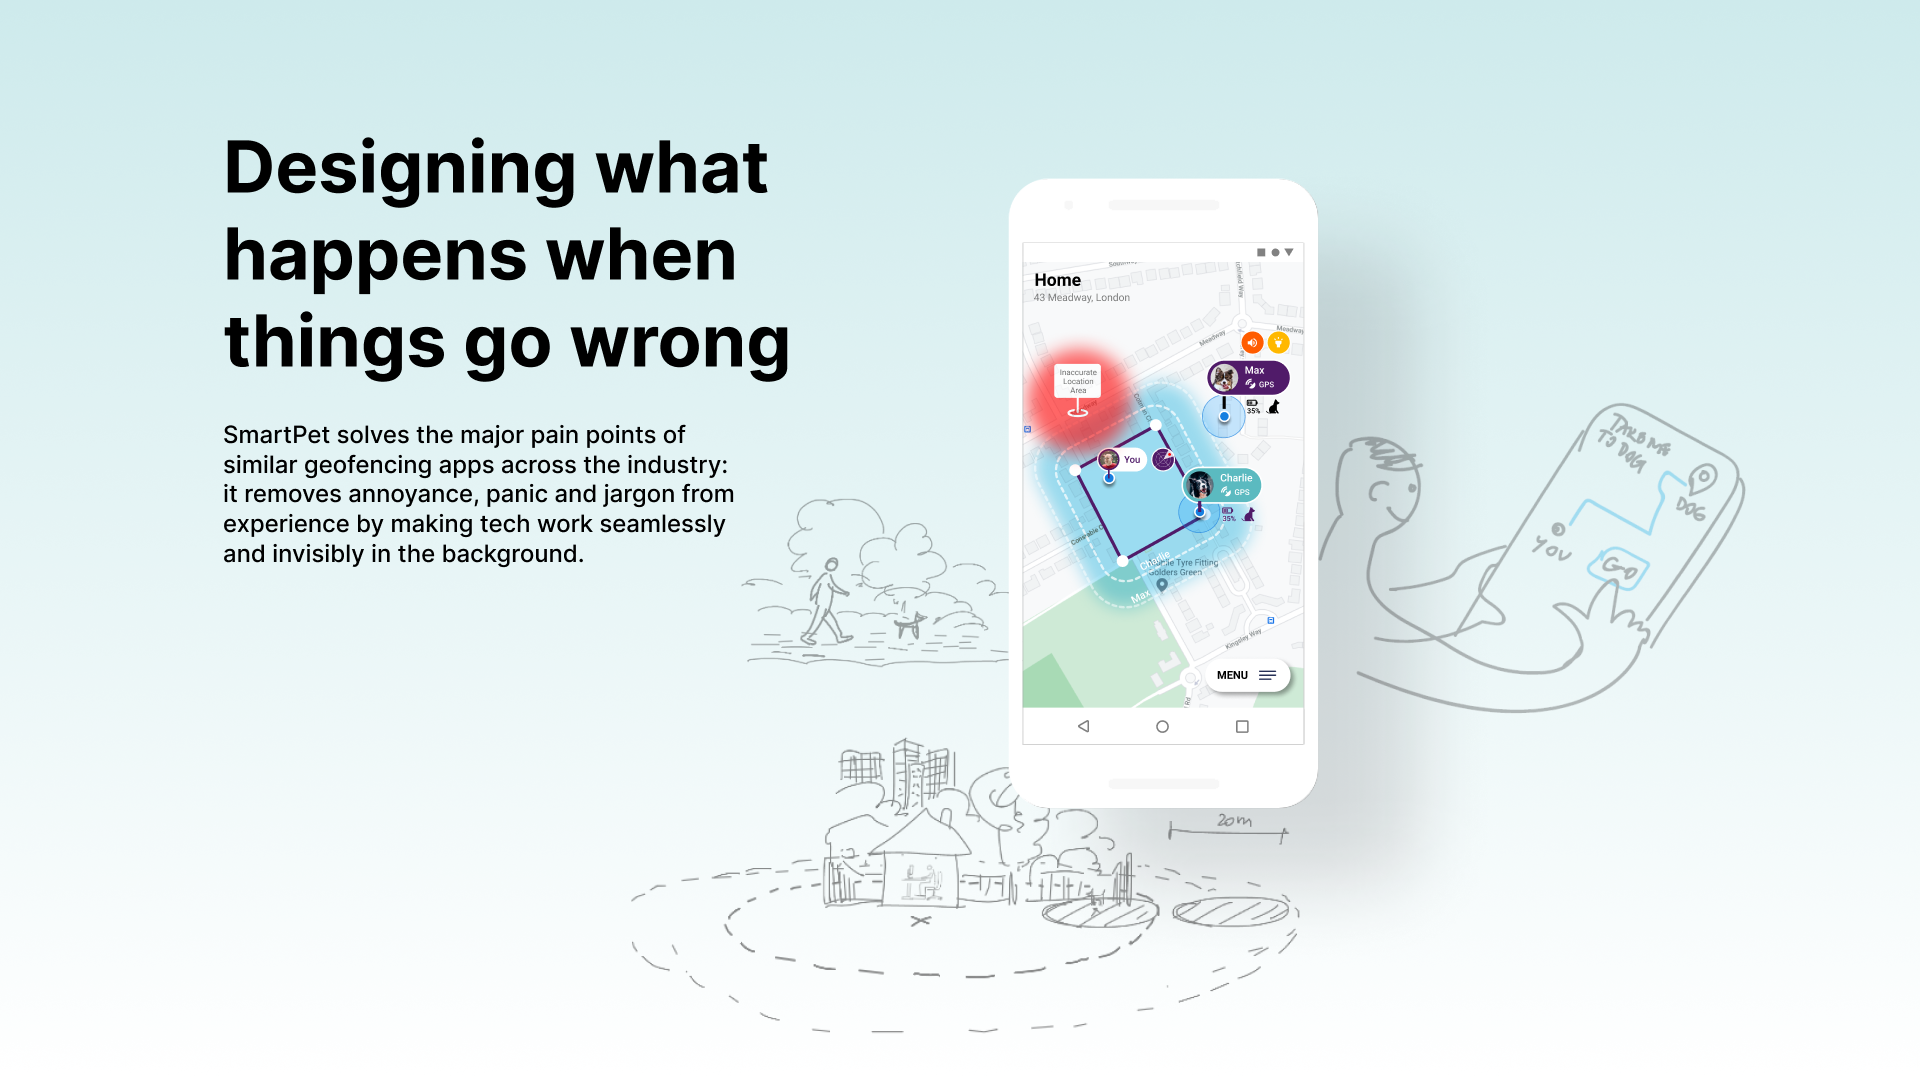
Then, with IDF Bootcamp I wanted to redo SmartPet as a more realistic study, where I would go beyond what the competition is currently doing. I wanted to understand and solve the pain points that users of GPS tracking apps have — and more generally, to understand and solve geofencing apps issues. In fewer words, to design what happens when things go wrong.

The ideal story
- You create a fence
- If your pet escapes the fence, the app warns you instantly with an alarm.
- Following the app directions, you go after your pet and find it.
- Everything is great again!

…But…
This is only the ideal (official) version of the story — the one all competitors are advertising. In reality — as most product reviews show — all GPS tracking devices for pets have significant accuracy errors, rendering these simple tasks “useless”.

The real story
- You create a fence
- Because of accuracy problems, the app tells you the pet has escaped, but the pet is actually near you.
- The app will give you directions to your “lost” pet, but instead, you start worrying about how reliable this app really is.
- Everything is not great — you wanted to buy some peace of mind, but instead, you got extra annoyance and even more worry. You will soon start thinking that this app is misleading (and perhaps worse than nothing).

So what’s the (special) challenge?
The special challenge is to understand why and how these problems happen (the real model) and to integrate the findings into the “ideal” version of the story (track your pet, build a virtual fence around it, go after pet in case it escapes the fence, and find it).
Spoiler — the basic solution to real model

My role and process
As this was a Bootcamp UX project, I managed all roles. As a business stakeholder, I wanted to have similar hardware to the competition, in order to highlight the UX opportunities. As a student, I was looking to go beyond the basic requirements for such a system; also, I wanted to develop the competence scale pictured below:

I set out to:
- identify if there’s a real user need for such a system — and if not, to adapt it (for example, for tracking teenagers);
- identify the key user groups and the key tasks they want to carry out;
- create usability objectives, IA, and interaction design;
- go ahead of the competition and address the main users’ pain points;
- create a journey map including the most important pain points scenarios;
- understand what causes these issues, solve them (and communicate them) through design;
- draft a product vision to position my study against competition;
- develop the user flows for each scenario;
- mockup a prototype and put it in front of users (usability testing) to validate my hypotheses;
- iterate in order to improve the design;
- evaluate the solution and prepare it for handover, considering Material Design best practices.
Design Methodologies
I can adapt the UCD process depending on project type, time and budget.
1st stage: Quantitative and qualitative research to understand the context, users’ needs and business objectives.
2nd stage: Defining product vision; creating user stories for persona building, scenarios and tasks we want to test.
3rd stage: Iterate with prototyping and usability testing.
4th stage: Deliver the product: prototype, presentation, and design documentation for development.
My role in this four-stage iterative process is to constantly keep my team informed about the real users and their experience.

1. Discover
- Desk research. Statistics
- User interviews
- Key insights to inform further research
- Product reviews
- Competitive analysis
- SWOT
- The brand opportunity
- Affinity map — key insights
1.1 Desk research. Statistics
I started my research with user interviews and statistics and I became aware of biases from both quantitative and qualitative research. Minor changes in a quantitative phrase can significantly alter the message:

At the same time, I realized the importance of using both types of data to advance towards a better understanding of who the real user groups are. The product reviews research helped “triangulate” my assumptions, and to pivot to a more accurate key user group.
I’ve started my research trying to find out if there is a need for a tracking device for pets. To estimate a rough number of device owners on the market, I’ve counted the number of installs on Google Play of a few dozen geofencing apps using GPS. 750k+ installs on Android at a market share of 3/1 for Android means 1M+ app installs. Two of the top five companies have 5% and 1% market share (1% is 10k clients). So it seems like there is some need for such a system.

I was also looking after some rough data on:
- how many pets there are in the world (~850M)
- how many are lost and found (~120M)
- how many are lost and never found again (~20M).
At this point, I had already assumed two main user groups: owners with a lost& found pet, and owners who had lost their pets forever.

1.2 Semi-structured interviews (x4)
I wanted to find out how people think, feel and act during a stressful event like losing a pet. Based on four interviews, the odds of interviewing a person who lost forever their pet was less than 1:10, but the odds of talking to someone who had lost&found again their pet were around 1:2. I didn’t want to find out if people would buy a device — the odds (1:200) were too small to hope for any luck. Instead, I brought an open discussion around the existence of such devices. None of the four pet owners express an intention to buy a GPS device — and each had their good particular reasons.


1.3 Key insights/takeaways so far to inform further research
- At this point, I already knew there was a need for a GPS tracker for pets. But I also wanted to know if there was even more demand for a tracker for kids; also, how different are cat owners vs dog owners needs [link].
- The vast majority of pet owners do nothing after losing a pet forever or after losing&finding a pet again. So maybe losing a pet is not the main driver of getting a tracking device. At this point, I assumed that these two categories might not be the best categories for our users.
- There are around 1M devices for cats&dogs worldwide. 14% of worldwide dogs get lost(65M), but only 1% of all dogs get lost forever(4.5M) in a five-year period. And they sometimes get lost forever because their owners can’t or won’t keep them anymore. So accidentally losing a dog and wanting it back happens for way less than 1% of all dogs.
- It’s easy to get biased by statistics, especially when you have enough large numbers. I couldn’t check how reliable or accurate the numbers were, and I couldn’t triangulate all of them. Fortunately, the key numbers had different degrees of magnitude (x, 10x, 100x), so they were reliable for basic assumptions (eg “1% odds of losing a dog forever” can be used as “Losing a dog is not that common”).


1.4 Product reviews
The main insight I’ve already gained from previous research activities was that losing a pet may not be the most helpful criterion to drive research forward.
I’ve researched Amazon reviews of the top four competitors in order to detect the key user groups, their context, and their goals.
Most often people need “peace of mind” and “our dog is the most precious thing to us” (the latter less often, but still significant). These two key phrases seem to provide better insights into the two main persona(s).

Pet owners who already own a GPS tracker are people who want to reduce the chances of losing their pet. Ideally, they want to remove this problem totally, but the technology (at least in the GPS trackers I’ve included in my analysis) is buggy and not too reliable, so people have learned that losing their pet is still a possibility — although reduced. So these people are proactively looking for a way to reduce the odds of losing their pet.


1.5 Competitive analysis
Products don’t live in a void — a competitive analysis is always useful in shaping the product vision. Four major competitors making around 3/4 (or more) of the whole market have their unique pros and cons, cost differently, and have different market shares depending on cost and whether they are available worldwide or not. They’ve all had the same start (being founded roughly at the same time, in 2012–2013).

What can we learn from comparing them on these criteria? What makes a leader in this market? Here are some insights:

- Whistle has only US coverage and it’s 2–3 times more expensive than the leader, Tractive. Whistle is the only one amongst the five top tracking devices on the market that puts fitness first and tracking second. If they had worldwide coverage, they would probably be world leaders, because they have better branding and UX than Tractive
- Trackimo and Tractive have both worldwide coverage, but Tractive has 10x installs — and that’s probably because Tractive is four times less expensive than Trackimo. Even if Trackimo sells trackers for all kinds of purposes, they still seem to have 10x fewer clients. I assume it’s because of both price (4x more expensive) and very poor branding (you can’t figure out which device is for pets, for cars or for both pets, kids, or cars; similar shapes, sizes, branding). If Trackimo were cheaper and if they had better branding, they would probably be market leaders.
- Weenect, like Trackimo, sells devices for all kinds of purposes and are unable to differentiate them clearly. But Weenect cost is similar to market leader, Tractive — 4x cheaper than Trackimo. While Weenect only sells in the EU, for a 10x smaller market (Trackimo sells worldwide), Weenect still seems to have 2x clients. So a 4x price increase means 20x less clients. If Weenect had worldwide coverage and better branding, they would probably be market leaders.
1.6 SWOT
I’ve focused the SWOT analysis on the UX of products in order to determine the opportunities SmartPet has. All competitors share the same common UX weaknesses:
- too many features (and buggy),
- poor content design
- poor branding (except Whistle)
- poor communication between device-app-user when it comes to technological limitations, which are the actual pain points (poor accuracy and refresh times, triggering freezes and false positives).

1.7 The brand opportunity
Except for Whistle, all main competitors are poor on branding — their iconotype (the drawing/icon in the logo) is as stereotypical as a location icon. They tend to use abstract invented names (unlike Whistle, who again got it right); they use vague slogans and they all tend to have very landscape logos.
Looking at the above competitive analysis, it seems that three elements matter most: market coverage, price and branding.
So I’ve done a quick positioning exercise to determine how a potential candidate might look, feel and sound like. I’ve used the following criteria: colour, typography, naming, icon, slogan, composition; and I’ve also used the SWOT insights that are about UX opportunities (like humanizing the interaction and the technology). The idea in which your dog becomes smart when wearing the device (by telling you where it is) was an obvious good candidate, because it makes the technology invisible: it’s easier to imagine communicating with a being you already know instead of talking to a GPS device.


1.8 Affinity map. Key insights
At this stage it was time to conclude all the divergent research so far, to make sense of the gathered insights, and to build support for a product vision. The SWOT and brand analysis helped to put in context and clarify all research so far.

- “Having lost a pet” is not the best attribute for a key group, and instead it’s better to get into a dialogue with people who love their pets and care about them enough to proactively look for solutions against losing them.
- The people I interviewed love their pets and care about them too, but all the problems and pain points that come with a tracker were simply not worth taking for them. And they are not completely wrong, because the odds of losing forever a pet are apparently quite small.
- The people who decide, though, to buy a solution against losing their pets, have to cope with several pain points that make their life harder: they want to buy peace of mind, but they get only half of it; the other half is the uncertainty caused by lack of network coverage, serious connection lags, false “pet got away” alarms or simply unresponsive signals from a device whose battery is depleted — which means you’ve lost your pet.
- The technology is more or less unreliable, and since our device is most likely to use similar hardware, our opportunity is to close the UX gap between sloppy technology and people who want to have peace of mind.
- The competitive analysis helped me gather the opportunities into a product vision that served as a reference point for the design stage: “prevent and educate” instead of “deal with a lost pet”.
- Cost, UX, and branding seem to matter more to product perception than hardware, monthly price structure and international coverage).


2. Define
- Opportunity and product vision
- Key user groups
- Persona(s)
- Key tasks
- Pain points
- Sketching and storytelling on main user need
- Journey map
- User stories
- Task flows
- Site map. IA
2.1 Opportunity and product vision
The competitive analysis of the top four competitors highlights their functional approach, poor content design and branding, usage of technical jargon, and squeezing functions which are not amongst the key tasks. So, the opportunities are to focus on the key tasks, to create a more emotional brand and content, and to use UX to bridge the communication gap between technology inaccuracies and user mental models. Ideally, the app should not command or tell the user what to do. Instead, the app should assist the users and involve them as part of the solution.

We’ll be addressing the practical side of our project by solving the tasks, interaction design, content design and usability; and we’ll address the emotional side of our project with a humanistic brand using plain English and speaking user needs. For our current project (the app), we’ll only focus on the practical side of the problem, leaving the emotional needs and communication to a more integrated marketing effort. I’ve only sketched the product vision so I could keep in touch with the larger context of our product.
2.2 Key user groups
People who lost&found a pet and people who lost forever a pet seemed at first the natural assumptions for user groups, but product reviews and competitive analysis suggest a better approach: consider first the people who proactively try to prevent a “lost pet” situation.


2.3 Persona
Our persona is either a hiking person enjoying the outdoors or someone who loves their pet to the point of considering them a human friend or a child. The practical side of our persona likes hiking or long walks in the nearby park or wood, while the emotional side of our persona wants to always know/control where their pet is. If there were no tracking devices like SmartPet, our persona would be terrified to get their dog out of the leash for a long walk in the park.

This description of our primary persona is inclusive enough for the “I’ve lost a dog in the past” group, but at the same time is different enough so as not to exclude people who have never lost a pet (who seem to be our best group).
The market leader’s slogan is “Never lose your dog again”, suggesting an appeal only to people who have already lost their dog (only 14% of all dogs).
2.4 Key tasks
In theory, there are three key tasks:
- See your pet location on a map;
- Create a “virtual” fence that warns you when your pet escapes it;
- Go after your pet when it has run away.
As we’ve seen before, the technology inaccuracies create a few major pain points when trying to deliver these apparently simple tasks. In practice, you need to also add these:
4. Reduce false alarms (indoors, outdoors at home);
5. Improve accuracy;
6. What to do and to know if you have lost a pet;
7. What to do if you have no coverage when walking with your pet or going after a lost pet.
2.5 Pain points

2.6 Sketching and storytelling on main user needs to discover the real model of why, how and where pain points happen
In order to empathize with Chris, our persona, I’ve started sketching his four contexts, to help discover the reference points of the journey map.
If our product didn’t exist, Chris would ideally need an assistant to take care of his dog when he is busy with other stuff (work, family, leisure). The assistant needs to be reliable (his current assistant, a competitor app+device, disturbs him with warning messages while the dog is just fine in the courtyard or in the house).

Chris needs this type of assistant in three contexts that cover most cases:
- Working and getting busy at home while the dog is in the house or in the courtyard;
- Walking in the park or in the wood near the park;
- Working at a client’s office during the day, while the pet is either in the garden or taken care of by someone else (this is basically a sharing option that delegates someone else to look after a pet in case it runs away. I will leave this context to a future phase).


2.7 Journey map
After I sketched our persona context, I drafted a journey map covering a full day, touching on the first phase pain points. This exercise proved the most significant way to engage in a realistic manner with all the research and insights gathered so far. From the outside, journey maps can seem maybe just formal documents, but to better understand what I was going to solve, the journey map exercise was an eye-opening lesson.

The real model — what causes the false alarms (and their usual contexts)
Currently, existent products trigger false alarms because of two main causes that can work independently or combined:
Cause 1

When GPS is available, its poor accuracy (represented by the location blue circle) crosses the safe fence, triggering a false alarm. The best accuracy for GPS tracking devices for pets is an 8m radius circle in best weather conditions and good sky exposure (to at least four GPS satellites). In less than perfect conditions, this 8m radius guess area — the blue location circle — increases. This becomes a major nuisance when you’ve set up a fence because the accuracy error can easily fall off the safe virtual fence area, which you’d usually set up just around the courtyard (and it might not be wider than 16m).
Cause 2

When the minimum of four GPS satellites required to calculate location is not available (eg you’re indoors, in a heavy forest, near tall buildings, or in bad weather), tracking switches to cell towers, which have much lower accuracy (for 5G it’s up to 200m radius, for 4G up to 1km, for 3G up to 2–3km, and for 2G up to 4–5km). Cell towers’ low accuracy always crosses the safe fence, triggering false alarms. Google Locations tries to solve this situation by moving the location dot to the closest available nearby Wi-Fi that your tracker is detecting, but this can easily cross the safe fence, triggering a false alarm (illustrated below).
How do cached locations work?
Google, Apple and Microsoft regularly check your location and they gather your Wi-Fi ID too, in order to improve their Maps coverage (they do this anonymously, and only if you have the option enabled). In this way, they gather each Wi-Fi ID’s physical address. When cell tower accuracy is low and you have enabled “Use precise location” on the app, any Wi-Fi ID detected by the pet tracker is sent to Google/Apple/Microsoft, and they return the location stored in their Maps database.
Some Wifi’s are opted out from this, so you only get Wi-Fi’s that are available (you can change these settings from your phone location settings). If the pet tracker passes near an apartment building with many Wifi’s per sqm, the location shown on the map could be very accurate. But if your pet tracker is in heavy wood in a suburban area where there is only 3G coverage with an accuracy of 1km radius and no contributing Wifi nearby for Maps to detect, you’re most likely to have a problem.
The real model — contexts (resulting from journey map)
Most problematic situations fall under the four below contexts, and I’ve ordered them by the increasing risk of losing a pet (1=low, 4=high):
- The tracker is at home indoors, where you have poor or no GPS accuracy; the light blue circle is so big that it crosses the fence and triggers a false alarm. Users report just closing the device when indoors to avoid multiple false alarms caused by the ”useless device” (see Cause 1 above).
- The tracker is at home around the house, but because the tracker is perhaps hidden under the pet and if the pet sits inside its wooden house under a tree, the location jumps to cell towers and then to the closest Wifi cache Google has available — which usually causes a false alarm (unless you’re contributing to Maps with your Wi-Fi ID; but you might not have any Wi-Fi). When there is good GPS accuracy and the tracker has well left the virtual fence, it may be a real alarm (see Cause 2 above).
- The tracker is outdoors, there is good GPS accuracy, and it crosses the safe area, triggering a real alarm. You might have no safe fence active either — say you’re walking the dog in the park, and it suddenly runs away. You need to go after your pet (see the ideal story above), but unlike the ideal situation, the GPS accuracy is not great.
- The tracker and/or your phone have no coverage, which is perhaps the situation with the greatest potential of you losing your pet.
The four contexts above describe the real model and the contexts I need to design around.
How shall we solve these four situations with a user-centered design approach, considering we can’t expect users to want or need to know any of the insights we’ve gathered? In fewer words, how can we invisibly incorporate these insights into design?
2.8 User Stories
The below user stories take into account the most challenging four contexts of our real model: the first two deal with GPS inaccuracies that trigger false alarms; and the last two happen when GPS can’t connect to the tracker (because of poor sky coverage or network coverage).

2.9 Task flows
Scenario 1 — reducing false alarms indoors
User story: As a pet owner and working from home, Chris wants to minimize false alarms notifications from the app while pet is indoors (where there’s poor GPS/cell coverage), so that he can focus on work with minimal interference from his pet.
Challenge / Real model: when indoors, the GPS signal is not reliable, and it switches to the cell network, which has huge accuracy errors, triggering false alarms when a safe virtual fence is active. Users report shutting down the device completely to avoid multiple false alarms.
Solution: Trackers can send signals (pings) to your Wi-Fi network, and if they detect it, it means your pet is around. That sounds like a great fix! but… We need to also design what happens when:
1. there’s poor / no Wi-Fi coverage > solution: I’ve created an Improve Wi-Fi coverage tutorial;
2. when you have no Wi-Fi > solution: I’ve created a Pet indoors option that disables notifications until there is good GPS coverage, signifying the pet is outdoors.

Scenario 2 — reducing false alarms outdoors at home / in the courtyard
User story: As a pet owner and working from home, Chris wants to minimize false alarm notifications from the app while the pet is in the courtyard so that he can focus on work with minimal interference from his pet.
Challenge / Real model: when outdoors, the GPS signal is reliable in theory, unless the tracker is hidden under the pet, or inside a pet house, or under a tree, and so on… in which case the tracker needs to find a backup.
Solutions: If the tracker still detects your Wi-Fi as a backup for GPS inaccuracies, then it’s great. But if you don’t have Wi-Fi, or if your Wi-Fi coverage is not great in the courtyard (for countless reasons including concrete walls or distance), then we’re left to rely on GPS/cell towers. In this case, we extend (in real-time) the virtual fence size with the GPS inaccuracy radius to avoid false alarms caused by GPS inaccuracy (the light blue area on the map) crossing the fence.
This solution works no matter the GPS/cell towers’ accuracy. However, the cell network inaccuracies will make the fence extension so large, that it will appear useless — eg 2km fence size in suburban leafy areas where there’s poor network coverage. But if a pet will run away, GPS accuracy will refresh almost real-time according to pet location, triggering a real alarm.
But what if our persona wants to improve accuracy? In this case, the tracker can check whether if it can detect any neighbor’s Wi-Fi — and if it finds any, it sends Google Locations the available nearby WiFi’s IDs to check if they have it stored; if Google has any, the Maps will “teleport” tracker’s location there. It’s not perfect, but still miles better than cell network coverage. (I’ve also explained Google’s cached locations in the Real Model section — jumping to a nearby cached Wi-Fi only works if you want “precise location” enabled in your Location settings).

Potential flaws of jumping your tracker’s location to a neighbor’s Wi-Fi location:
- The location algorithm has to pass through cell towers before connecting to a neighbor Wi-Fi, so the tracker has to delay notifications until switching to Google Locations;
- [The most significant flaw] Your fence doesn’t usually include your neighbours — so this will trigger a false alarm.
While our solution is simple (extend fence size with the accuracy radius ) the Wi-Fi ID complications appear because Google wants to improve the real accuracy with a trick. If we want our users to be free to choose any of the two solutions, we’ll just ask their help to assess if their tracker’s location is accurate — and if not, we’ll mark it on the map as “inaccurate”.

Scenario 3 — Real alarm / Go after pet / Improve GPS accuracy
User story: As a pet owner working from home (or walking in the park/woods), Chris wants to discern real alarms from the false notifications and when a real alarm is detected, he wants to improve the tracker accuracy so that he will find his pet as quickly as possible.
Challenge / Real model: when your pet is in the courtyard or inside the smart fence, you can immediately discard a false alarm by having a look around. After a while, our app will learn to ignore most false alarms triggered by neighbours’ WiFi, and you’ll receive significantly fewer notifications — and they will most likely be real alarms. This means we’ll be getting closer to the idealized version of the app — receiving a notification and expecting it to be a real alarm. The below scenario covers how the app communicates to Chris when he realizes his dog has run away.
Solution: after Chris confirms the app his dog has run away, we start a short tutorial:
- one-button location accuracy improvement (if “precise location” is OFF);
- reminder to use light, sound and compass;
- showing last five tracker positions on the map;
- a persistent link to 10 quick tips to help finding a pet.
If none of these will help to find his pet, we’ll suggest Chris contact us via chat or telephone so we can speed up finding his dog with our equipment.
There is a slight variation of this scenario: when Chris is walking in the park without a fence active around him and realizes he has lost his dog. In this case, if accuracy was good, he will find pet right away. But if accuracy needs improvement, Chris will initiate the “Improve GPS accuracy” tutorial via the warning next to the location blue circle. If he’d prefer to go after pet without improving accuracy first, he’d click on Menu > Help, and the most prominent link on that page is “I’ve lost my pet” (see below).

Scenario 4 — Prevention and Emergency
User story: As a nature lover walking his dog in the park or woods, Chris wants to make sure he has good accuracy and coverage on both phone and tracker, so he can let his dog chase wildlife while he can be confident the app shows the correct location.
Challenge / Real model: In this scenario, we will be focusing on prevention and emergency situations. Prevention is what we do when GPS accuracy or network coverage drops significantly; emergency is what happens when the tracker or the pet owner’s phone (or both) has no network coverage.
Solutions
Prevention: we’ll start an educational tutorial whenever GPS accuracy or network coverage drops significantly. We’ll suggest putting the pet on a leash.
Emergency / No network coverage: We’ll guide Chris back at his last phone coverage point; there we’ll do the same thing for the tracker: we’ll guide Chris to the last tracker coverage point. If none of these will help, we’ll ask Chris to call us; but if these work, we’re back to Scenario 3.

Most situations and their pain points are covered by these four scenarios (or a combination of these). I’ve integrated the four flows into a single one.

2.10 Site map
- The first version of the sitemap was adapted from the ideal key tasks.
- The second version was drafted as an open card sort exercise, taking card content from the top competitors’ apps.
- The third version emerged from a cognitive evaluation exercise.


3. Develop
- User scenarios
- Task design
- Paper prototype
- Usability testing 1 and insights
- Mid-fidelity prototype
- Usability testing 2 and insights
- High-fidelity prototype
- Usability testing 3 and insights
3.1 User scenarios
I’ve tried to create the minimum number of scenarios covering most situations and contexts, ranging from very safe/familiar to very unsafe/unfamiliar.
Scenario 1 — indoors/at home — false alarms
Pets can’t be lost indoors (ok, they can, but let’s not elaborate too much…); also, the low GPS accuracy triggers false alarms; these two factors determine people to turn off the tracker. We want to give them the option to use Wi-Fi detection or to mark their pet as “Indoors”, to reduce most (if not all) false alarms happening while pets are indoors.
Scenario 2 — around the house/in the courtyard
When pets are outdoors there is a potential for runaway pets. In theory, outdoor means better GPS coverage if the tracker is well exposed to the sky, but pets can usually hide in their favourite places where people can’t get easily. For this scenario, we’re ignoring the ideal case (when nothing happens or when real alarms happen), and we’re only focusing on reducing the false alarms caused by poor GPS coverage while the pet is outdoors around the house.
Scenario 3 — real alarms
In this scenario, we assist Chris whose pet has run away, while the tracker on the pet has poor GPS accuracy. The scenario is similar whether the pet is around the house or in the park. I decided to focus on the courtyard version of the scenario because in this context Chris can forget for long periods of time about his pet, and his vigilance is diminished because of the interfering false alarms.
Scenario 4 — prevention and emergency
This scenario is focused on an out-of-home context (walks, parks or woods). We promised Chris peace of mind, and we want him to be prepared when entering favourable contexts for losing pets. Poor GPS signal in a natural unbuilt area or poor cellular network can make it virtually impossible to find your lost pet. So each time we’re entering a poor GPS/cellular connection area, we suggest Chris first put his pet on a leash, and then we ask him to check out a few easy tips to improve GPS accuracy. If Chris has already lost his pet when he has no GPS or network coverage, we should guide him to the last recorded coverage points — and if these don’t help, we ask him to call us.
3.2 Task design
For my first hand-drawn prototype, built around the ideal version of the app, I’ve followed the process described by Carolyn Snyder in “Paper Prototyping” (Chapter 6 — Task Design).

3.3 Paper prototype
The first prototype focused on the ideal story (see where your pet is on the map, create a virtual fence, and when the pet escapes it, go after it). I wanted to test my assumptions about how users would make sense of the design as a whole, and then, more specifically, how they would use the available options to achieve their goals.

3.4 In-person moderated usability testing (and insights)
I’ve used the process I’ve learned in the UserFocus’ usability testing bootcamp. I wanted to test if users can make sense of the system in order to achieve their goals. Because the tasks were very simple (so I thought) I could test multiple assumptions I’ve made during sketching.

Insights:
- The process and paperwork required to plan, design, do and conclude formal usability testing can get a full-time job easily. Steve Krug’s “Rocket Surgery” lightweight approach was revealing.
- The most significant usability problems were not about layout or inherent gaps of interaction design of a paper prototype, but about the proper labeling (or the lack of it) of main navigation, page titles and action buttons: “Tracking”, “Real-time” and navigation arrows were practically invisible options to the user, when in fact they were the key to proper task completion.

3.5 Mid-fidelity prototype
Testing the “paper” prototype created around the key tasks taught me that:
- the thinking aloud protocol can noticeably disturb even users with a background in psychology. So I guess that making the methodology as invisible as possible would make people feel much more comfortable;
- functionalities named using jargon words like “Tracking”, “Real-time” or “Refresh time” go unnoticed and ignored. On the other hand, lack of necessary labeling was noticed and even confusing;
- the prototype needed to be more accurate in order to create a coherent mental image of what needed to be tested.

So, for the second prototype version — which was designed with the real users’ pain points in focus, I’ve paid more attention to how I’ve framed the “testing”, making it sound less formal and instead, putting more effort into task preparation and getting more clarity over what I wanted to find out from the test.
The focus of the second prototype was to facilitate usability testing on:
- onboarding tutorials on accuracy and virtual fence;
- improving accuracy while indoors (Wifi);
- reducing false alarms while indoors (Wifi, PetSafe);
- reducing false alarms while outdoors around the house.

3.6 Usability testing 2
In order to test the designs I’ve built around the user stories, I had to clarify my objectives for testing; then, design the tasks and write the script.
I wanted to test:
- if the users can make sense and use of the educational information presented during onboarding;
- if they understand why Wifi is the best option for pet detection while the pet is indoors or around the house;
- if they have learned to reduce false alarms indoors when they don’t have Wi-Fi at home;
- if the interaction design and content is clear enough to support their goal of reducing false alarms indoors and around the house.
Because the objectives were qualitative in nature (and because I’ve only tested with two users), there was no point in producing quantitative measures like a SUS score or a satisfaction survey.


Findings:
- the educational content of false alarms caused by Maps jumping to Google Wifi physical addresses was confusing — the mental model wasn’t understood, and both users said they only want to know where the real location was.
- the interaction design and content of marking a location as being false was confusing to both users.
- the rest of onboarding, the Wi-Fi and PetSafe options were clear, and the Wi-Fi tutorial options were remembered.
Main insights for the next iteration: simplify explanations of real models and avoid using the “False” label for inaccurate location areas (both in onboarding and in design).
3.7 High-fidelity prototype
The first hi-fidelity iteration followed the second usability testing (insights above). I had started to realize that people do really prefer to use products without even understanding the basic underlying technicalities — and even resist learning things that require thinking and undivided attention. In the revised design, I’ve removed completely the notions of false and neighbours Wi-Fi ID’s, replaced them with inaccurate, simply suggesting the app will learn to avoid notifications from that area.


3.8 Usability testing 3
For the third usability testing session I had created 11 tasks. This time I wanted to also get a SUS score and a one-question task survey for:
- app onboarding;
- onboarding for main features;
- reducing false alarms while indoors — using Wi-Fi, improving coverage, “pet safe”
- creating a fence (with an onboarding explaining Smart Area);
- reducing false alarms while the pet is in the courtyard;
- how the app prepares the owner to go after the pet when it ran away from home;
- going after a lost pet in the park using the Help menu;
- improving the tracker accuracy while in the park, in order to find the pet quicker in care it gets lost;
- putting the pet on a leash when the app detects poor or no coverage on the owner’s phone or tracker’s SIM;
- assisting the owner to go after a lost pet when their phone has no network coverage;
- assisting the owner to go after a lost pet when the tracker has no coverage.


Findings
First insight: people don’t want to learn how things work — they just want to use something without any knowledge of the underlying technology. They come up instantly with their own fabulations of how, for example, Wi-Fi works in conjunction with the tracker, even right after they are shown how it really works. I’ve found out about this insight in the previous test session, but I am amazed by how deep this resistance to learning new things is — even on people who have high IT skills.
My most significant surprise was how important accurate wording is to usability. One user lost her patience because words like accuracy and coverage impacted strongly her focus. Other user couldn’t stop expressing his confusion about vague terms like poor signal and improve signal, asking who is who when it wasn’t clear who the subject was (the tracker? the Wi-fi? the app? or the owner’s phone?).

Before & after
Insights based on the top three usability problems:
- Reduced the “how it works” onboarding from 24 screens to 15 (including animation frames) and making it a shorter story.
- Revised the vague wording for the Wi-Fi-related tasks.
- Removing potential confusion between coverage /accuracy and between owner / pet during the “lost my pet and & there is no network signal” scenarios.


4. Deliver
- Figma interactive prototype
- Design documentation
- High fidelity prototype
4.1 Figma interactive prototype
https://bit.ly/3eCrvNX [link opens in new tab]

4.2 Design documentation


4.3 High idelity prototype

Outcomes / reflection on work
While I’m happy that I went beyond the competitors’ solutions to the top problems their clients face and while I guess I’ve solved a common problem to all geofencing apps, I wish I could have done significantly more contextual inquiry work and usability testing with people actually using pet trackers.
Next
So far I’ve covered the two contexts in which Chris is taking care of his pet in person (described at 2.6). What’s left unexplored is the context in which Chris is away from his pet (eg working in an office during the day, or being abroad for holidays) and needing someone to take over. Being able to share the tracker (for a whole range of reasons) is definitely a substantial chapter.
Looking at the prioritized pain points left for phase 2 (shown at 2.5), there’s still unexplored potential in the device design (eg falling off pet). Also, battery life is an issue that can easily go straight from number 5 to an absolute top priority in no time; I’ve only started to dive into this with the addition of a motion sensor meant to only activate GPS when necessary (GPS is the top battery drainer).
I haven’t included it in my study, but the fitness side of such a device is also a whole niche — and most fitness products on the market sell even without a GPS sensor.
It would also be great to create a whole Help section built around helping people who lost their pets, even if they are only 14% of our target group. And last, but not least, it would be exciting to explore a design focused primarily on handling multiple pets and trackers simultaneously.
